SimplePractice Design System User Research
Supporting Designers by Improving the Design System with User Research
DEVELOPING THE RESEARCH PLAN
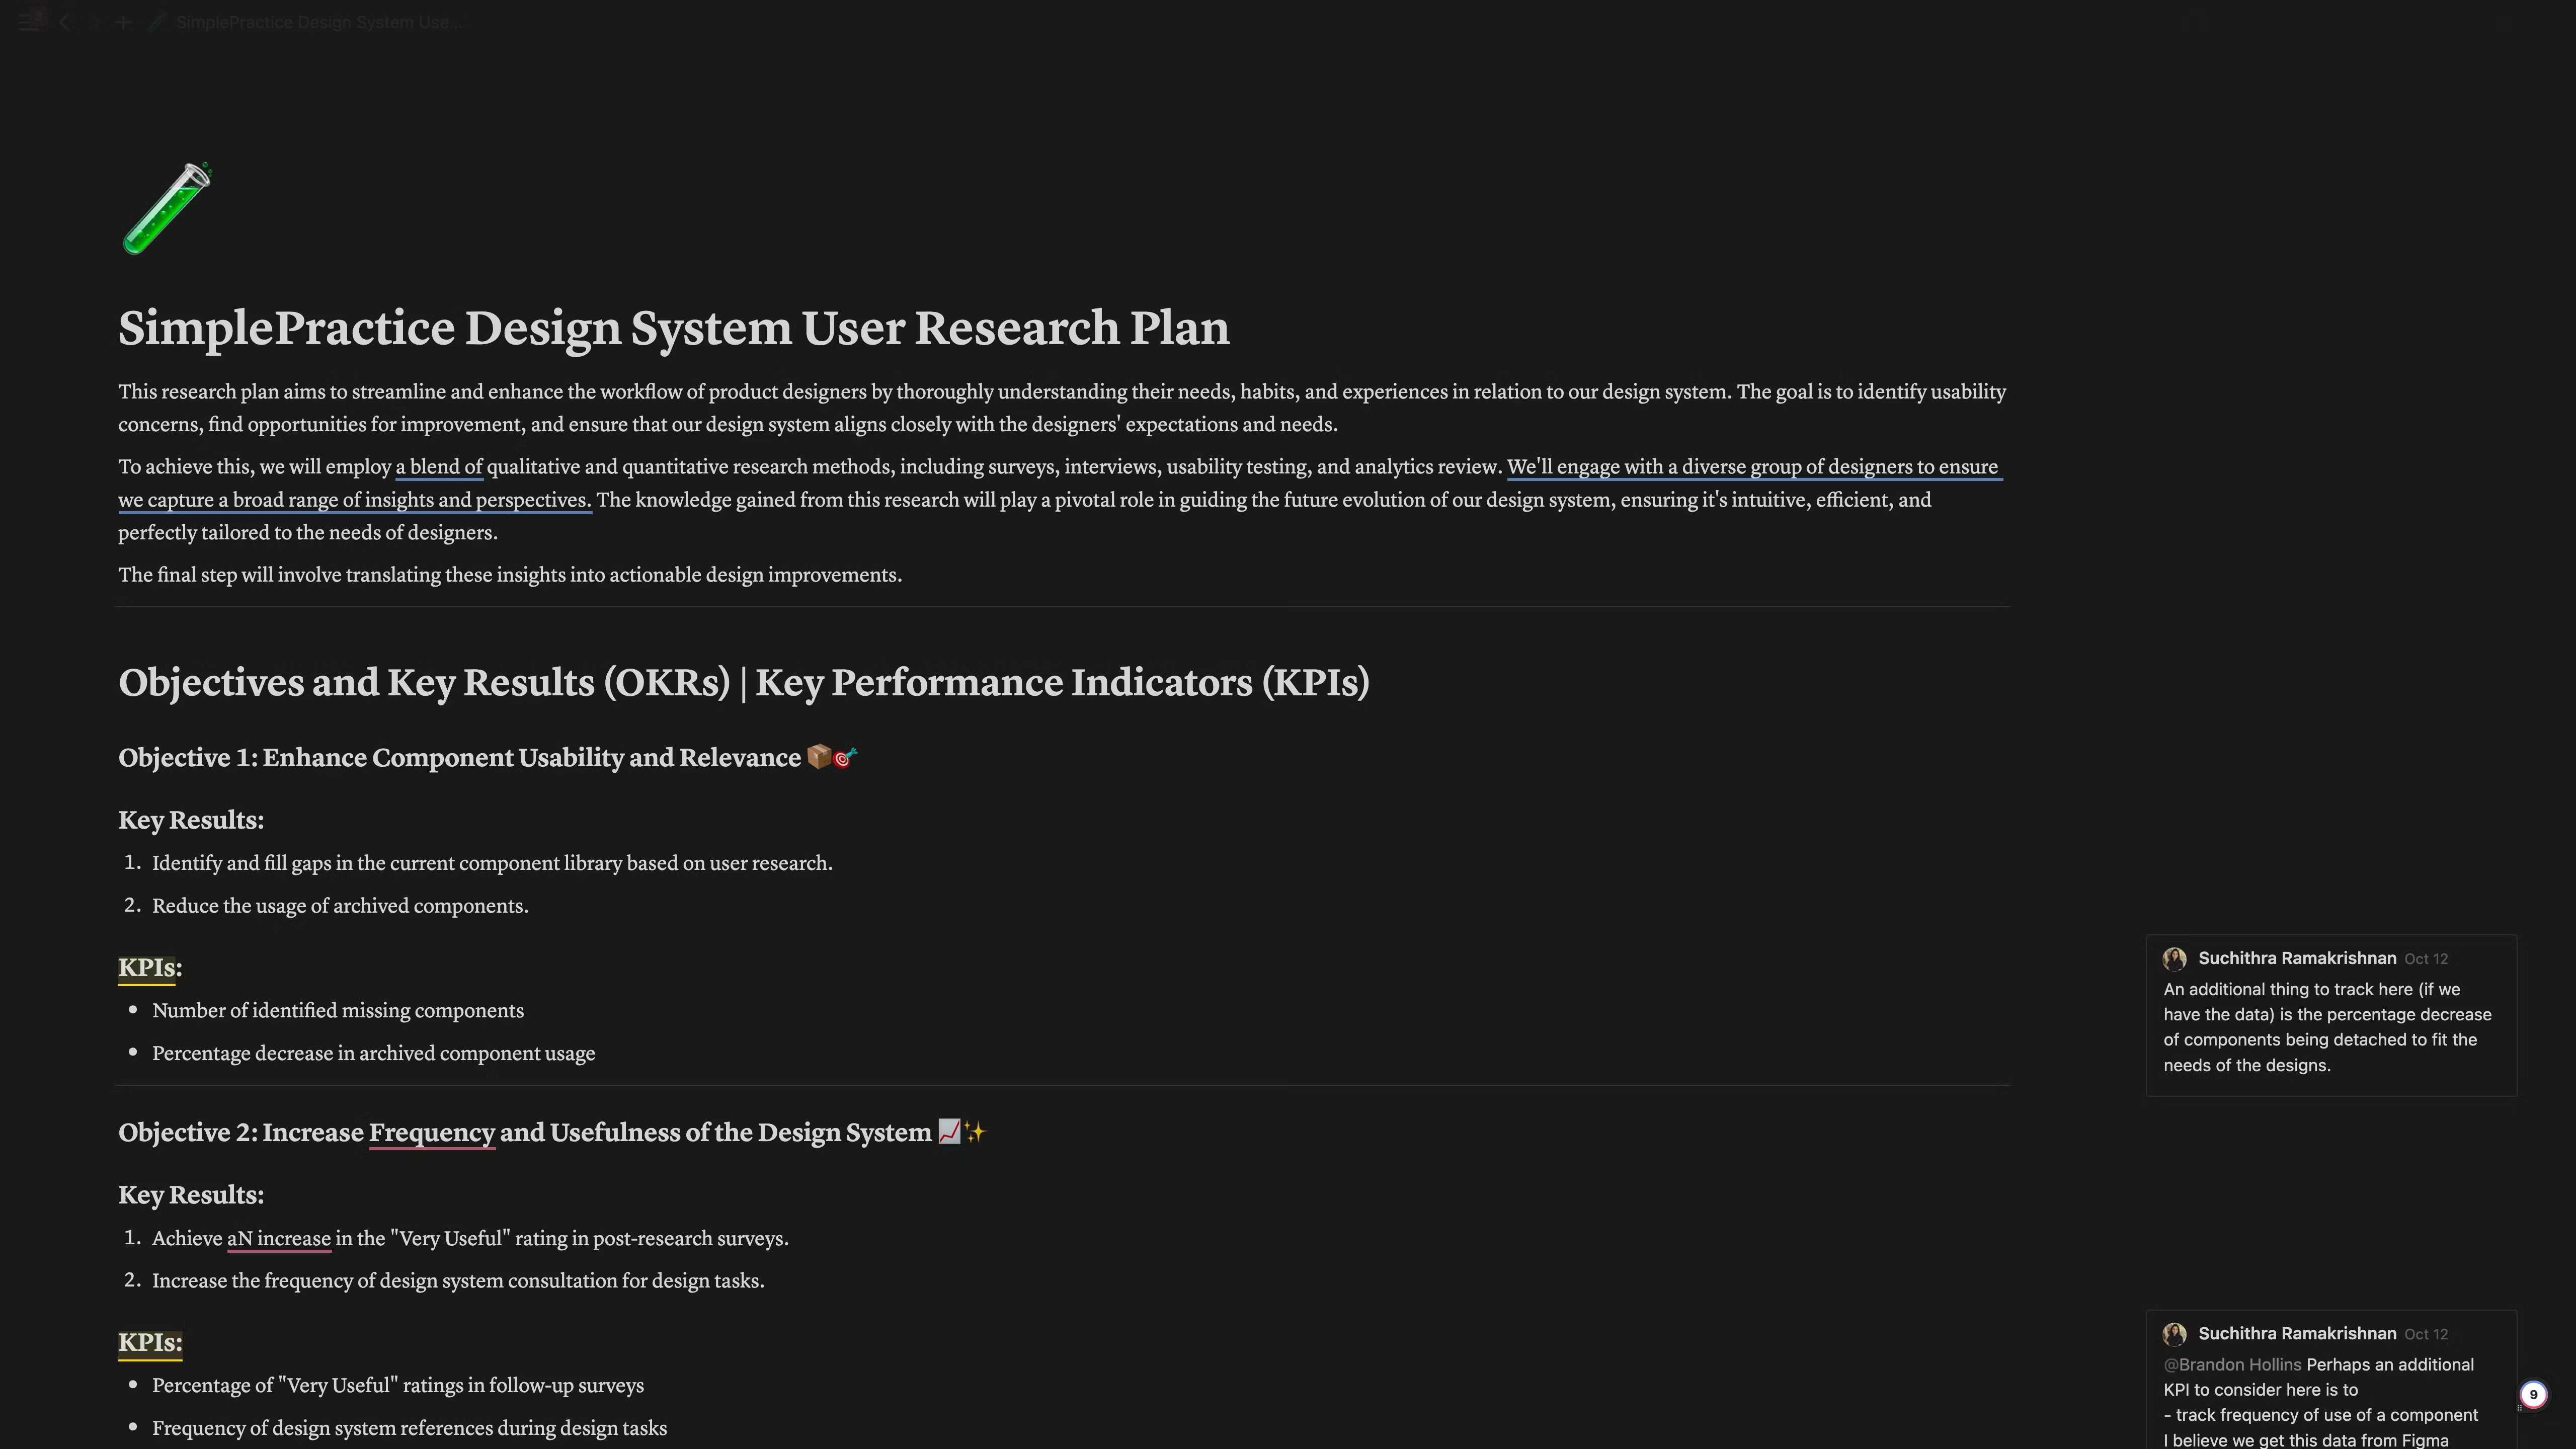
To kickstart this research initiative, I began by writing a comprehensive research plan. The research plan outlined the goals of the study, the research methods to be employed, and the specific areas of focus. This plan served as a roadmap for conducting the research and ensured that the study would be conducted systematically and effectively. By starting with a well-defined research plan, I was able to lay the groundwork for a successful research endeavor and set clear objectives for gathering insights from designers.
RESEARCH QUESTIONS
I formulated targeted research questions that dive deep into its usage, challenges, and potential areas for improvement. I categorized the research questions into three distinct groups: "Must-Know", "Nice-to-Know", and "Already-Know" - each tailored to uncover different layers of insights.
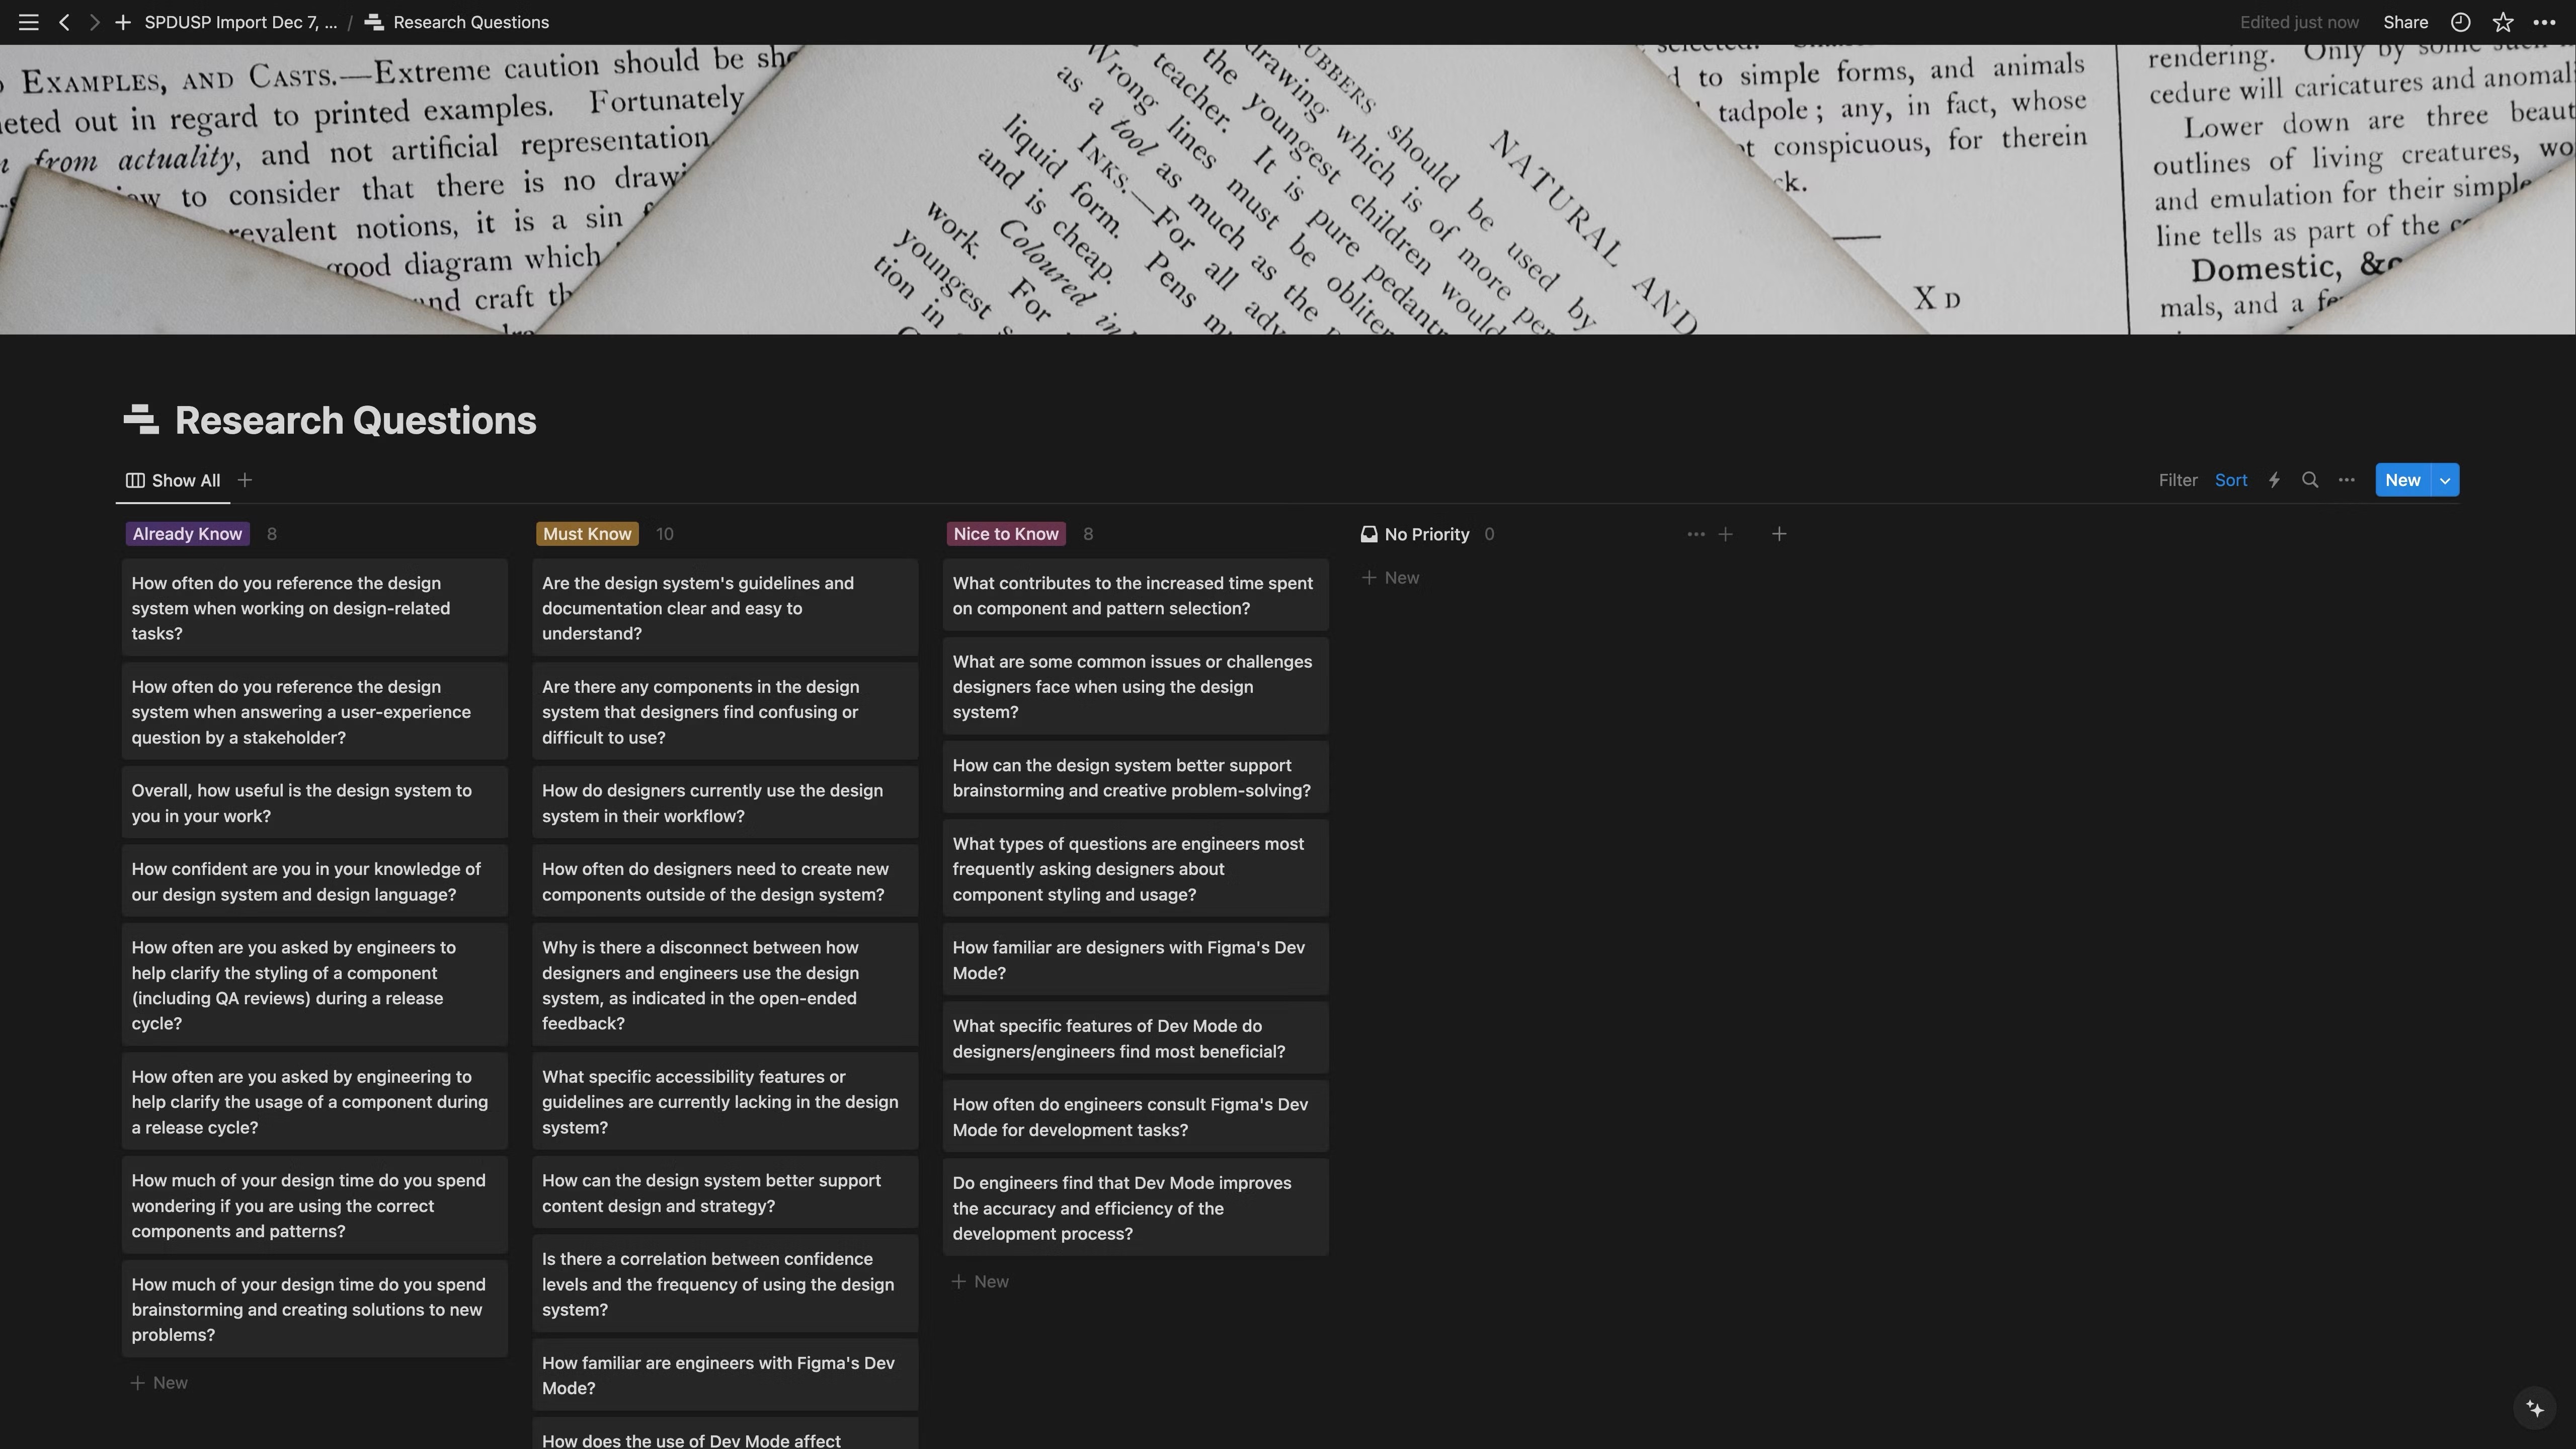
The "Must-Know" questions I developed are foundational, focusing on the clarity, usability, and how well the design system integrates into the workflows of designers. These questions examine the ease of using components, the need for creating new elements outside the established system, and how well designers and engineers are synchronized in using the system. Additionally, I probed into the system’s accessibility features and its support for content design and strategy, along with assessing the correlation between designers' confidence and their frequency of using the system.
The "Nice-to-Know" questions I crafted delve into more nuanced areas. I explored factors that contribute to the increased time spent on component and pattern selection, identified the common challenges faced by designers, and investigated how the design system could better support creative thinking and problem-solving. These questions also aimed to understand communication nuances with engineers, especially regarding component styling and usage, and to evaluate the familiarity with and impact of tools like Figma's Dev Mode on the collaborative process.
Lastly, the "Already-Know" questions I set out were to establish a baseline understanding of the current usage of the design system. These questions measured designers' confidence in the system, the frequency of clarification requests they receive, the time invested in component selection and brainstorming, and their overall perception of the system's usefulness.
BUDGET AND COST ANALYSIS
1. Resource Allocation: The research project will necessitate a substantial time commitment from ecosystem designers. This time is allocated across several critical stages: planning, conducting, analyzing, and reporting on the research. One of the key implications of this is the need to potentially pull these designers away from their other tasks, which could impact overall team productivity.
2. Internal Communication: A significant portion of time and effort will also go into internal communications. This involves coordinating with various teams and product areas to obtain necessary permissions and arranging interviews or testing sessions with designers. Such coordination requires not only time but also meticulous planning to ensure smooth communication across different departments and teams.
3. Time as a Central Cost: The overarching cost in this project is the time invested by every designer involved. This time is not just limited to the execution phase but extends across the entire lifecycle of the research project. From the initial planning stages, where research goals and methodologies are defined, to the development of research materials, scheduling of sessions, conducting the research itself, and finally analyzing and communicating the results - every phase demands dedicated time and effort.
DESIGN SYSTEM SURVEY ANALYSIS
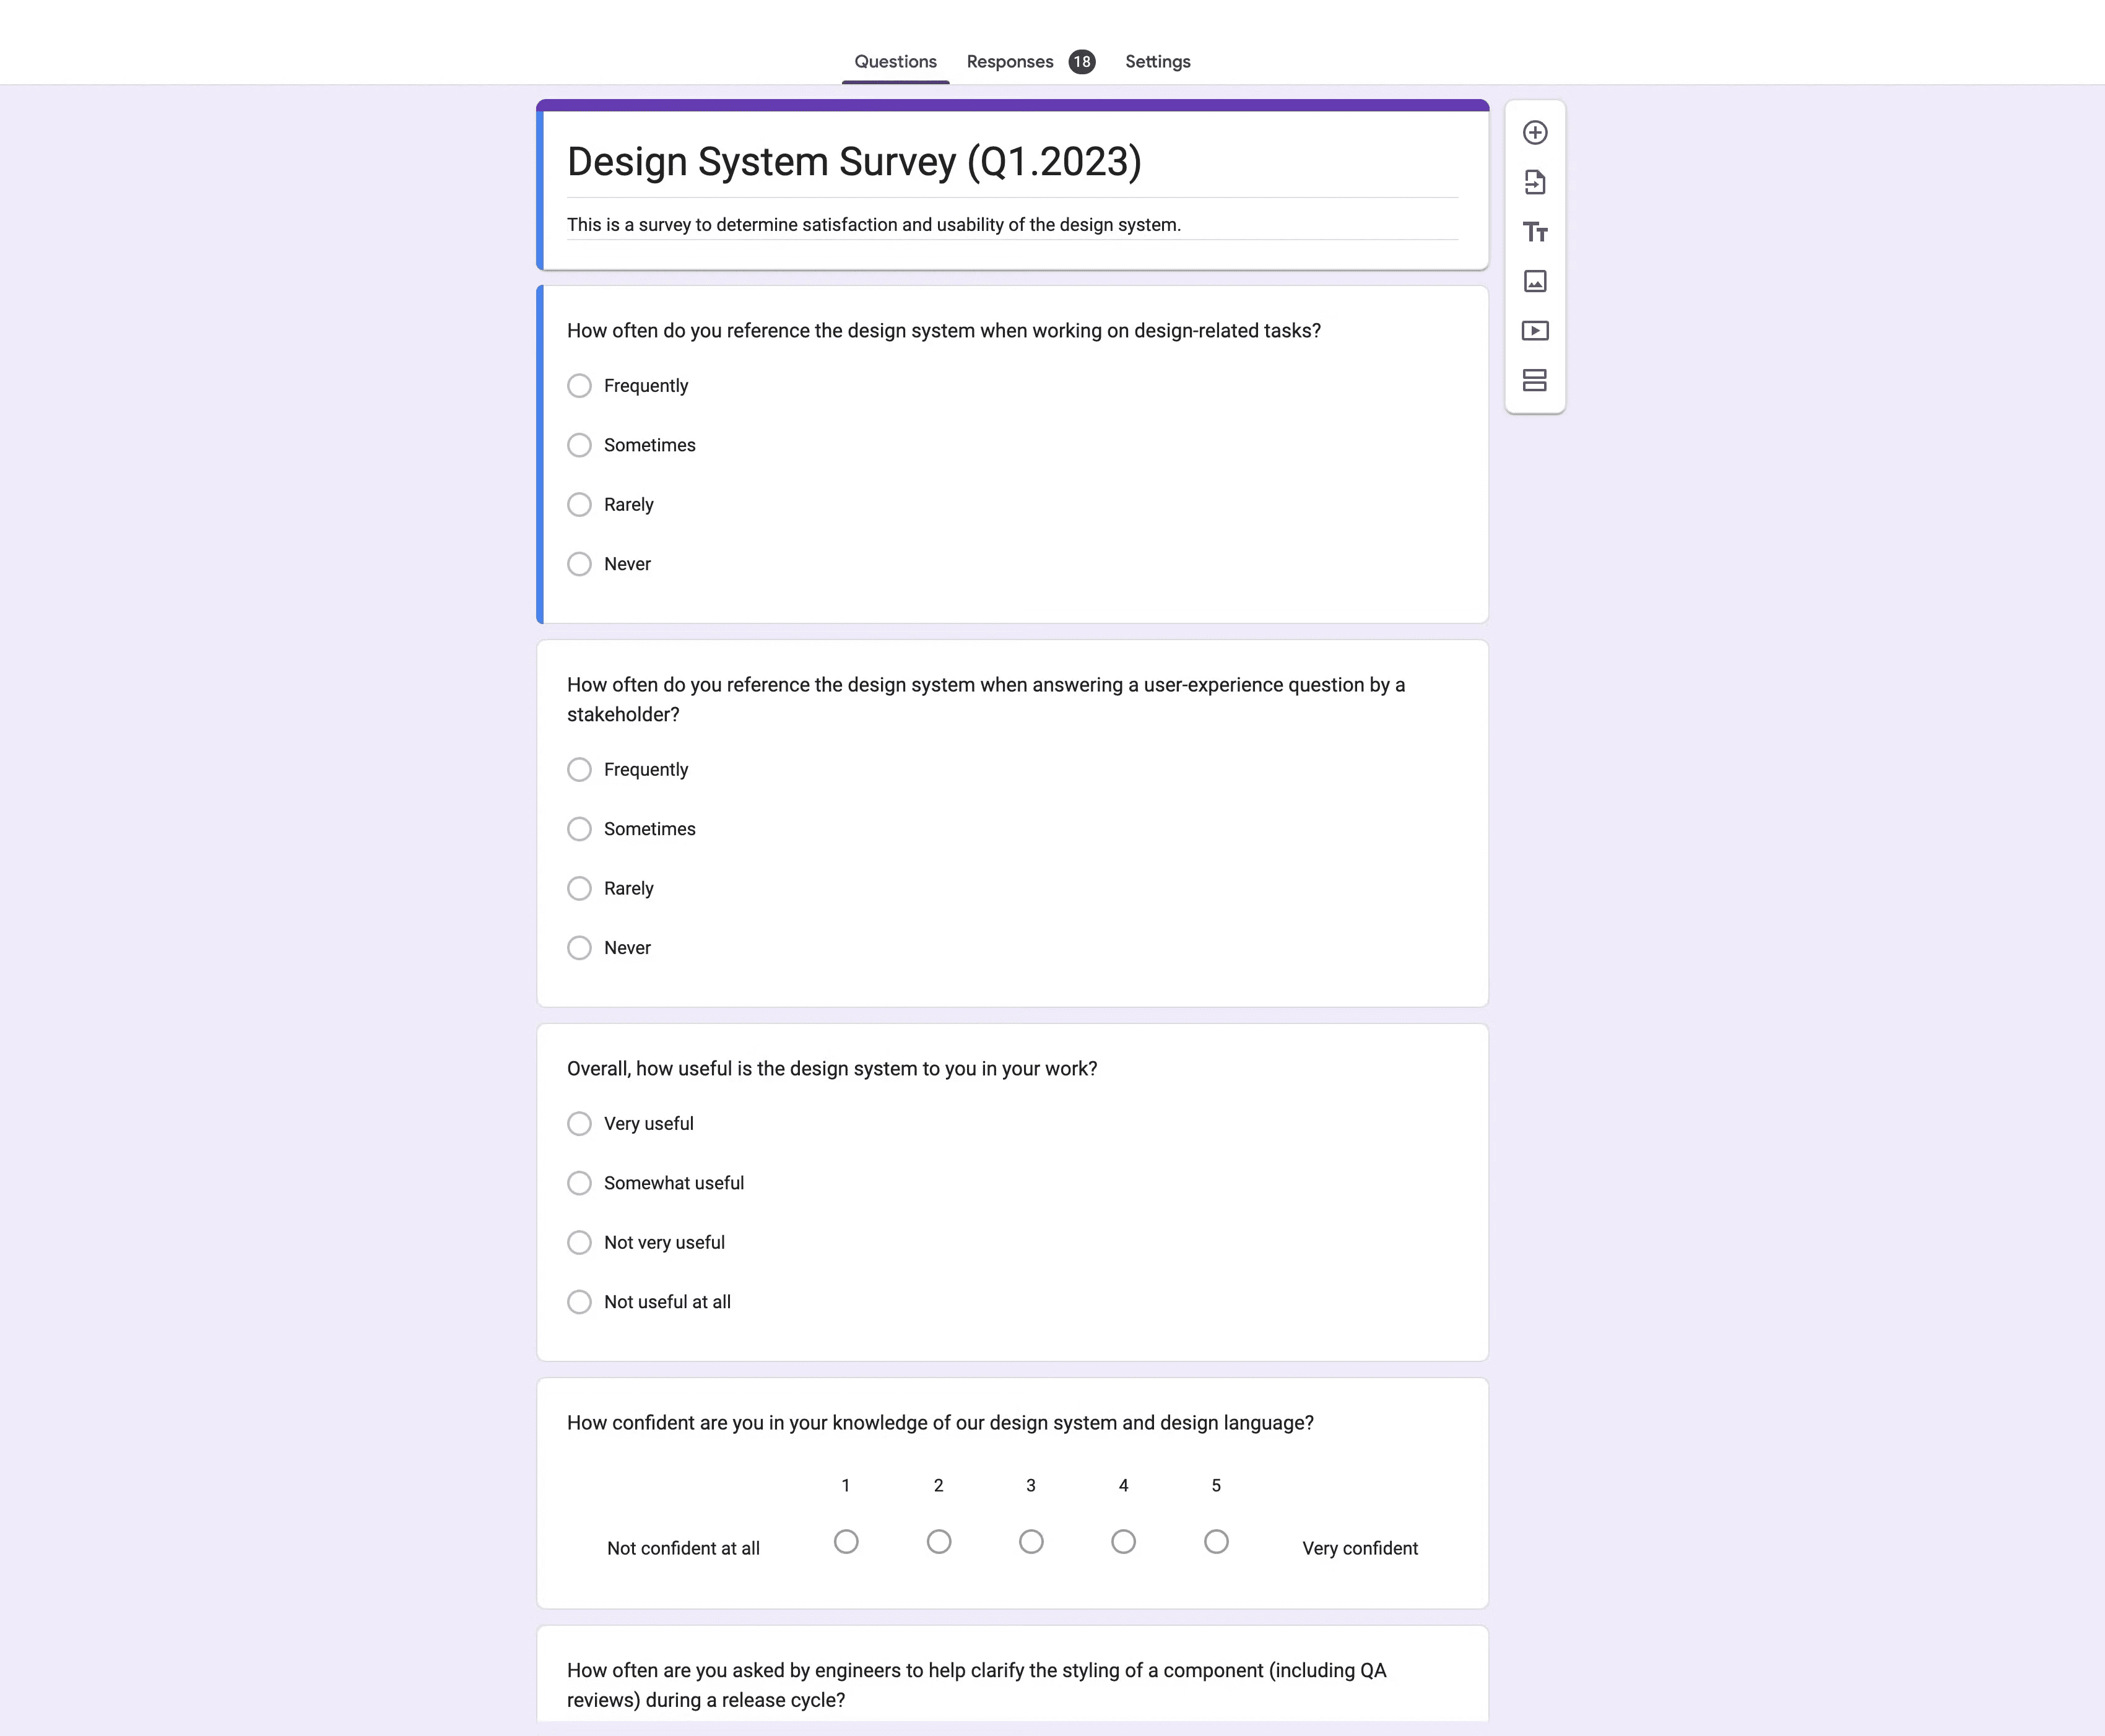
Ecosystem is committed to continuously improving our design system by gathering insights and feedback from our designers. To achieve this, two comprehensive surveys were conducted in Q1 and Q2 of 2023. This document provides an in-depth analysis of the survey results and outlines key takeaways to inform future developments. The primary objective of these surveys was to assess the effectiveness of our design system, measure its impact on the design workflow, and identify areas for improvement. Both surveys consisted of a mix of multiple-choice questions and open-ended questions aimed at capturing qualitative and quantitative data. The surveys were disseminated to all designers involved in the design process.
SURVEY QUESTIONS
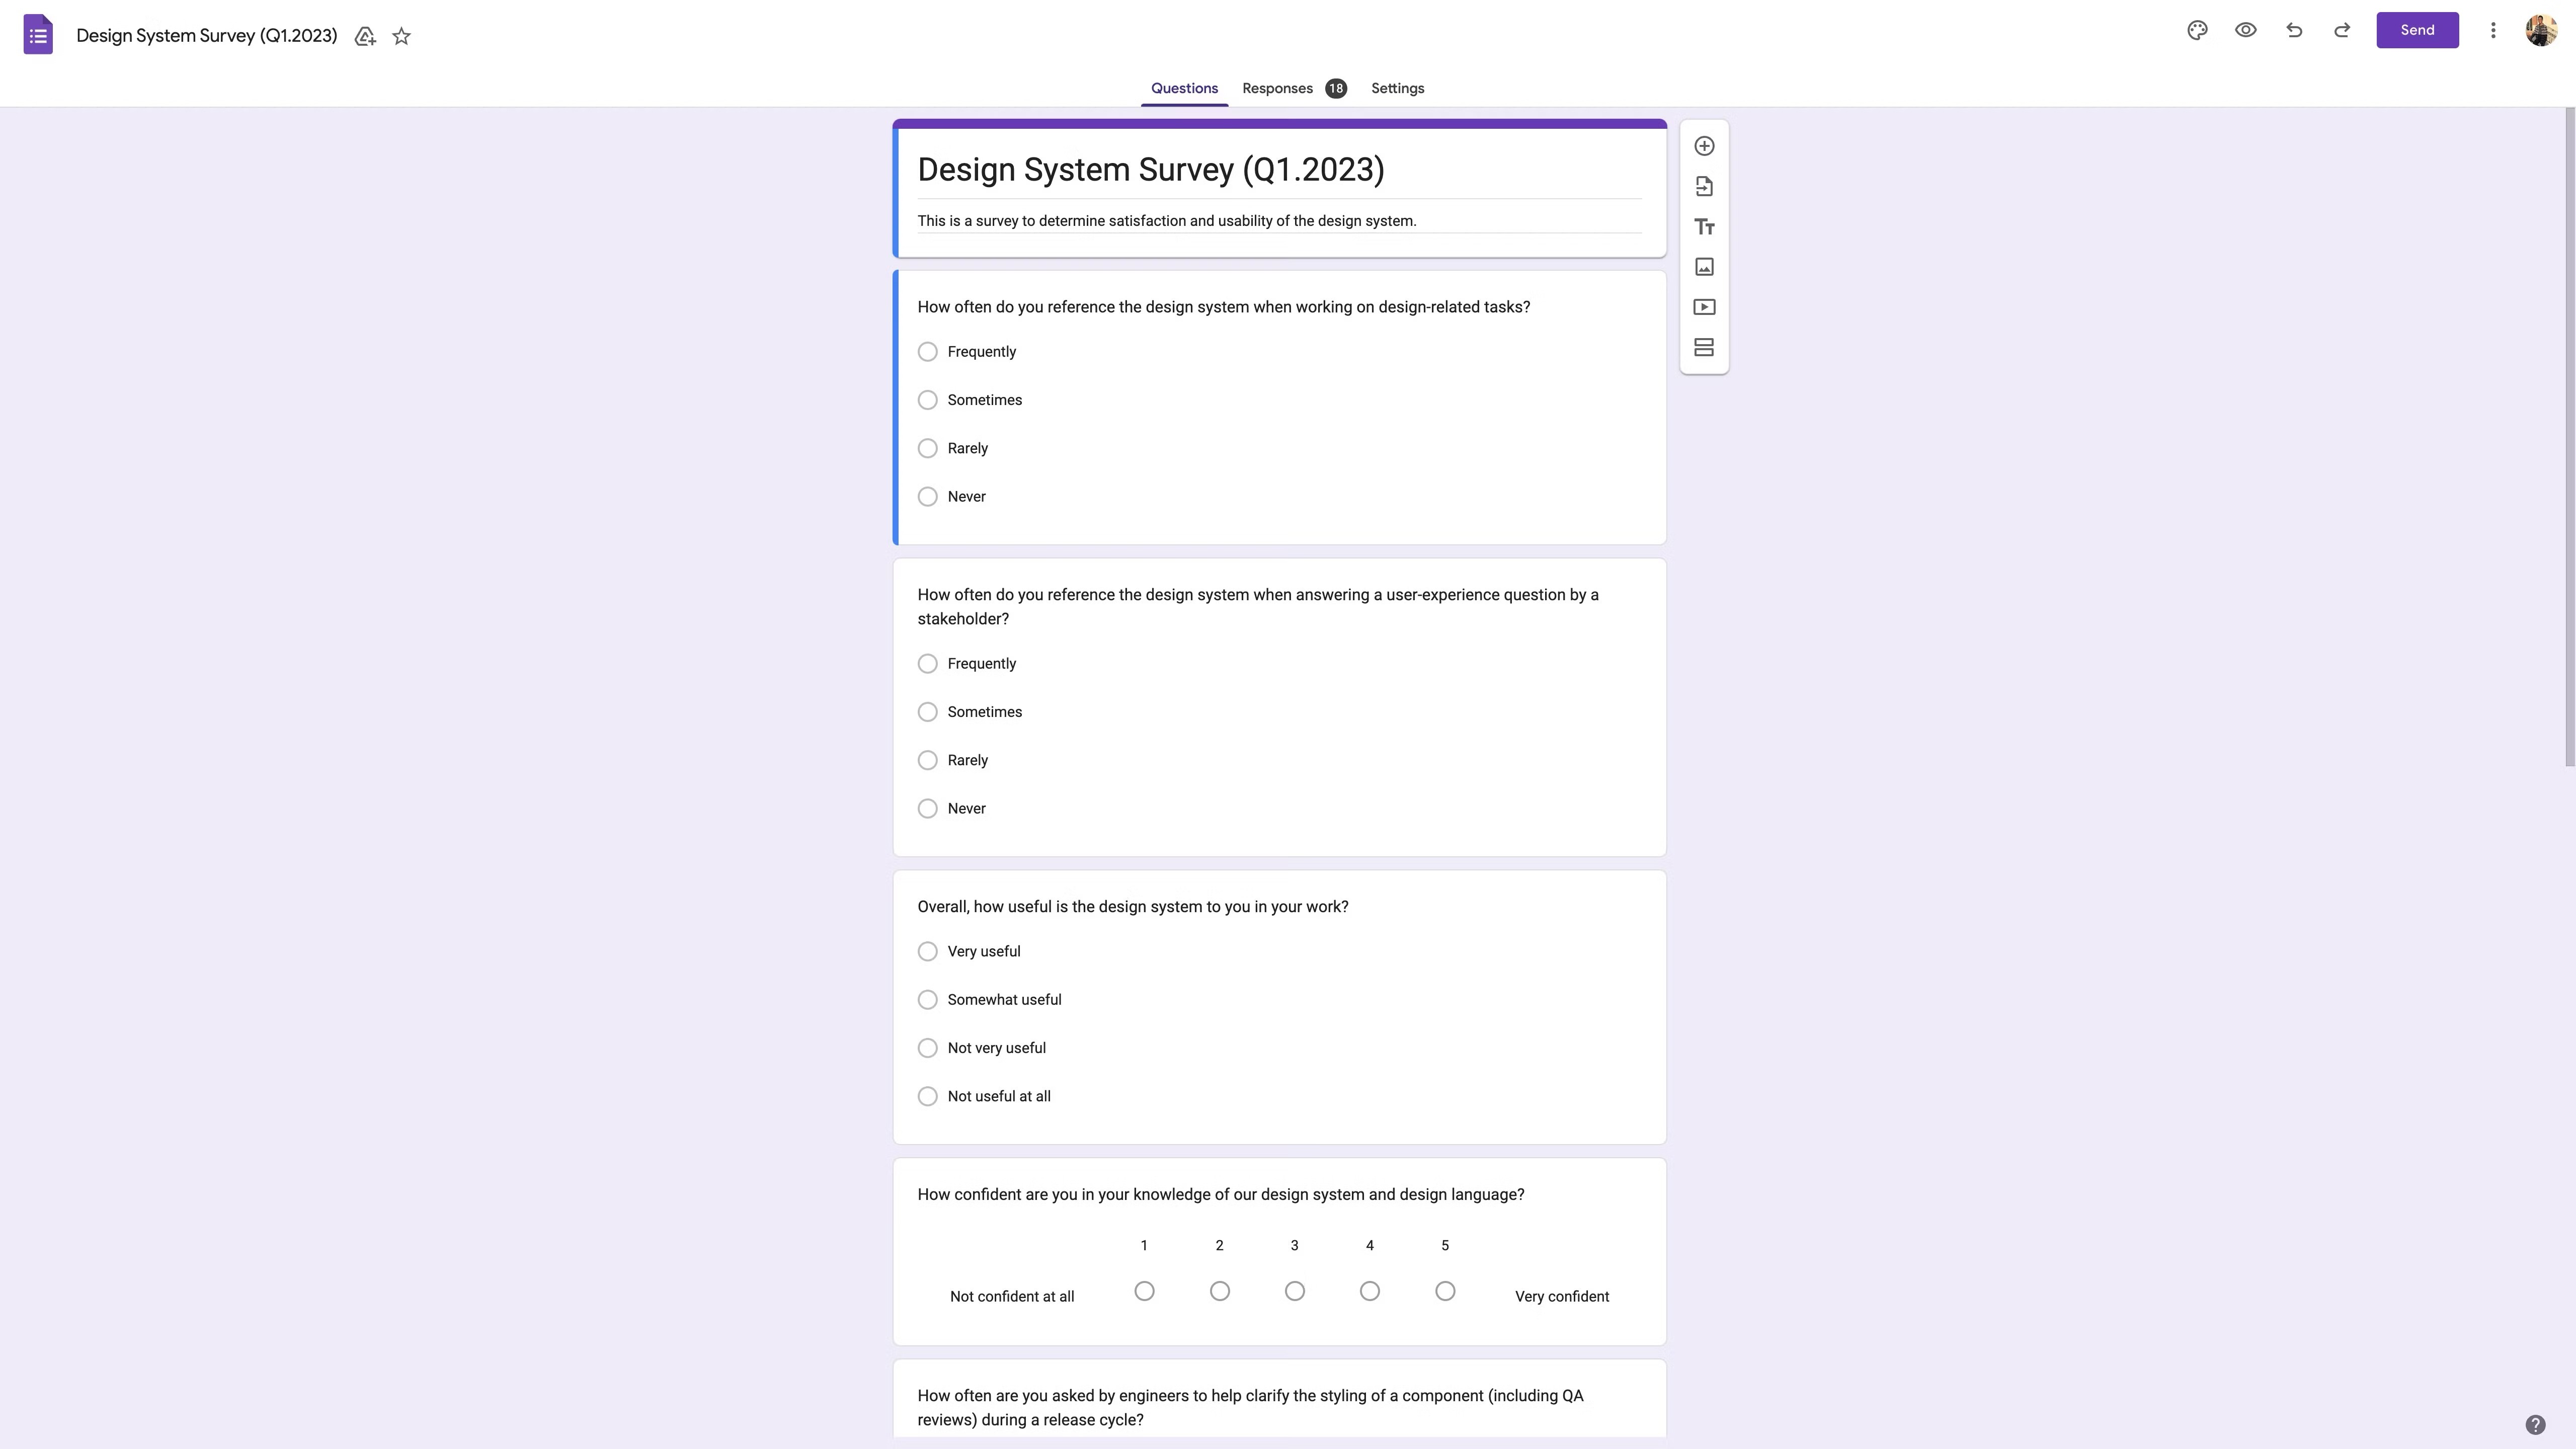
How often do you reference the design system when working on design-related tasks?
How often do you reference the design system when answering a user-experience question by a stakeholder?
Overall, how useful is the design system to you in your work?
How confident are you in your knowledge of our design system and design language?
How often are you asked by engineers to help clarify the styling of a component (including QA reviews) during a release cycle?
How often are you asked by engineering to help clarify the usage of a component during a release cycle?
How much of your design time do you spend wondering if you are using the correct components and patterns?
How much of your design time do you spend brainstorming and creating solutions to new problems?
Is there any other feedback you would like to share about your experience with the design system?
DESIGN SYSTEM SURVEY Q1 ANALYSIS
KEY TAKEAWAYS
Design Task References: Most respondents reference the design system "Often" when working on design-related tasks.
Stakeholder Questions: "Sometimes" and "Often" are the most frequent responses for using the design system to answer UX questions from stakeholders.
Usefulness: The majority find the design system "Very useful", which is a positive indicator.
Confidence: Most respondents are quite confident in their knowledge of the design system, with ratings clustered around the higher end.
Clarification on Styling: "Never" and "Rarely" are the most common answers, suggesting minimal interruptions for styling clarifications from engineers.
Clarification on Component Usage: Similarly, "Never" and "Rarely" dominate, indicating fewer interruptions for component usage clarifications.
Time Spent on Component Choices: Most designers spend "Less than 25%" of their time wondering about correct component usage.
Time Spent Brainstorming: A significant portion of designers spend "76-100%" of their time brainstorming and creating solutions, indicating a focus on innovation.
DESIGN SYSTEM SURVEY Q3 ANALYSIS
KEY TAKEAWAYS
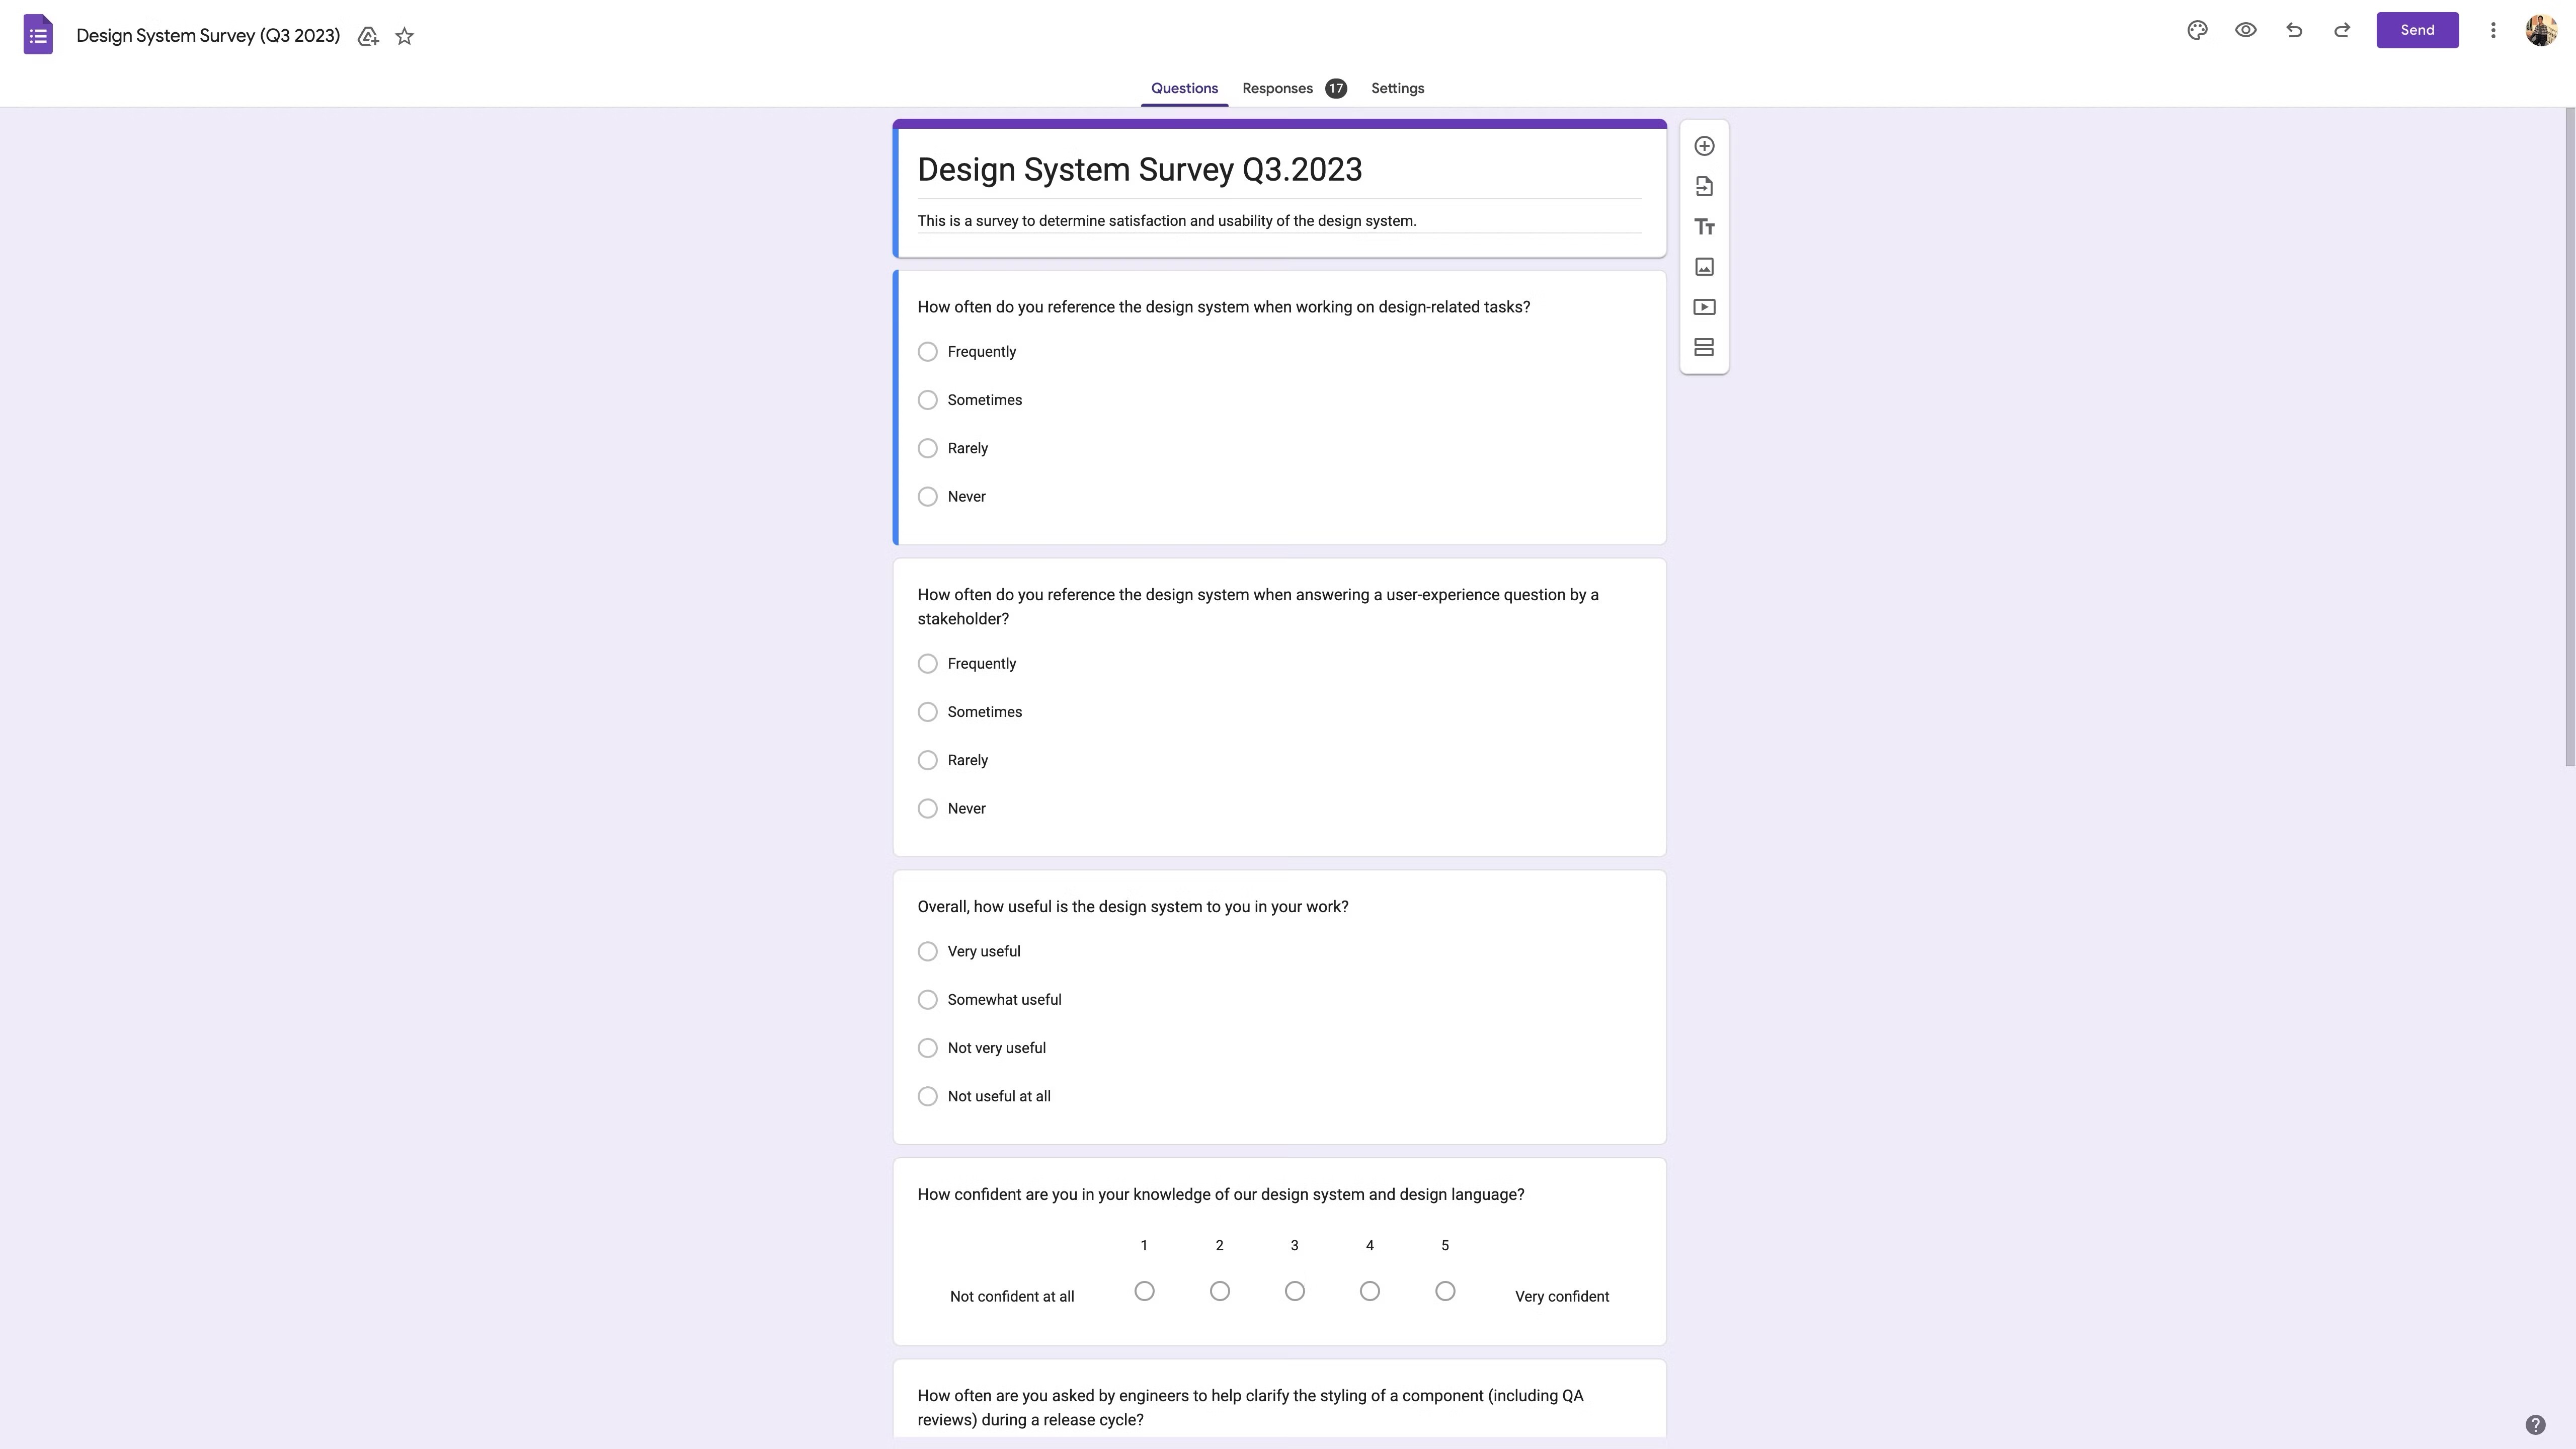
Design Task References: The responses are more evenly distributed across "Often", "Sometimes", and "Rarely".
Stakeholder Questions: "Sometimes" and "Rarely" are the most frequent responses, showing a slight shift from Q1.
Usefulness: Most respondents still find the design system "Very useful", although there's a noticeable count for "Somewhat useful".
Confidence: Confidence levels remain high, similar to the Q1 dataset.
Clarification on Styling: More respondents report "Often" being asked for styling clarifications, a shift from Q1.
Clarification on Component Usage: "Never" and "Rarely" still dominate, but there's a count for "Often" as well.
Time Spent on Component Choices: "26-50%" has seen an increase, indicating more time spent on component deliberation.
Time Spent Brainstorming: Time allocation for brainstorming and problem-solving remains largely similar to Q1.
FIGMA ANALYTICS DEEP DIVE
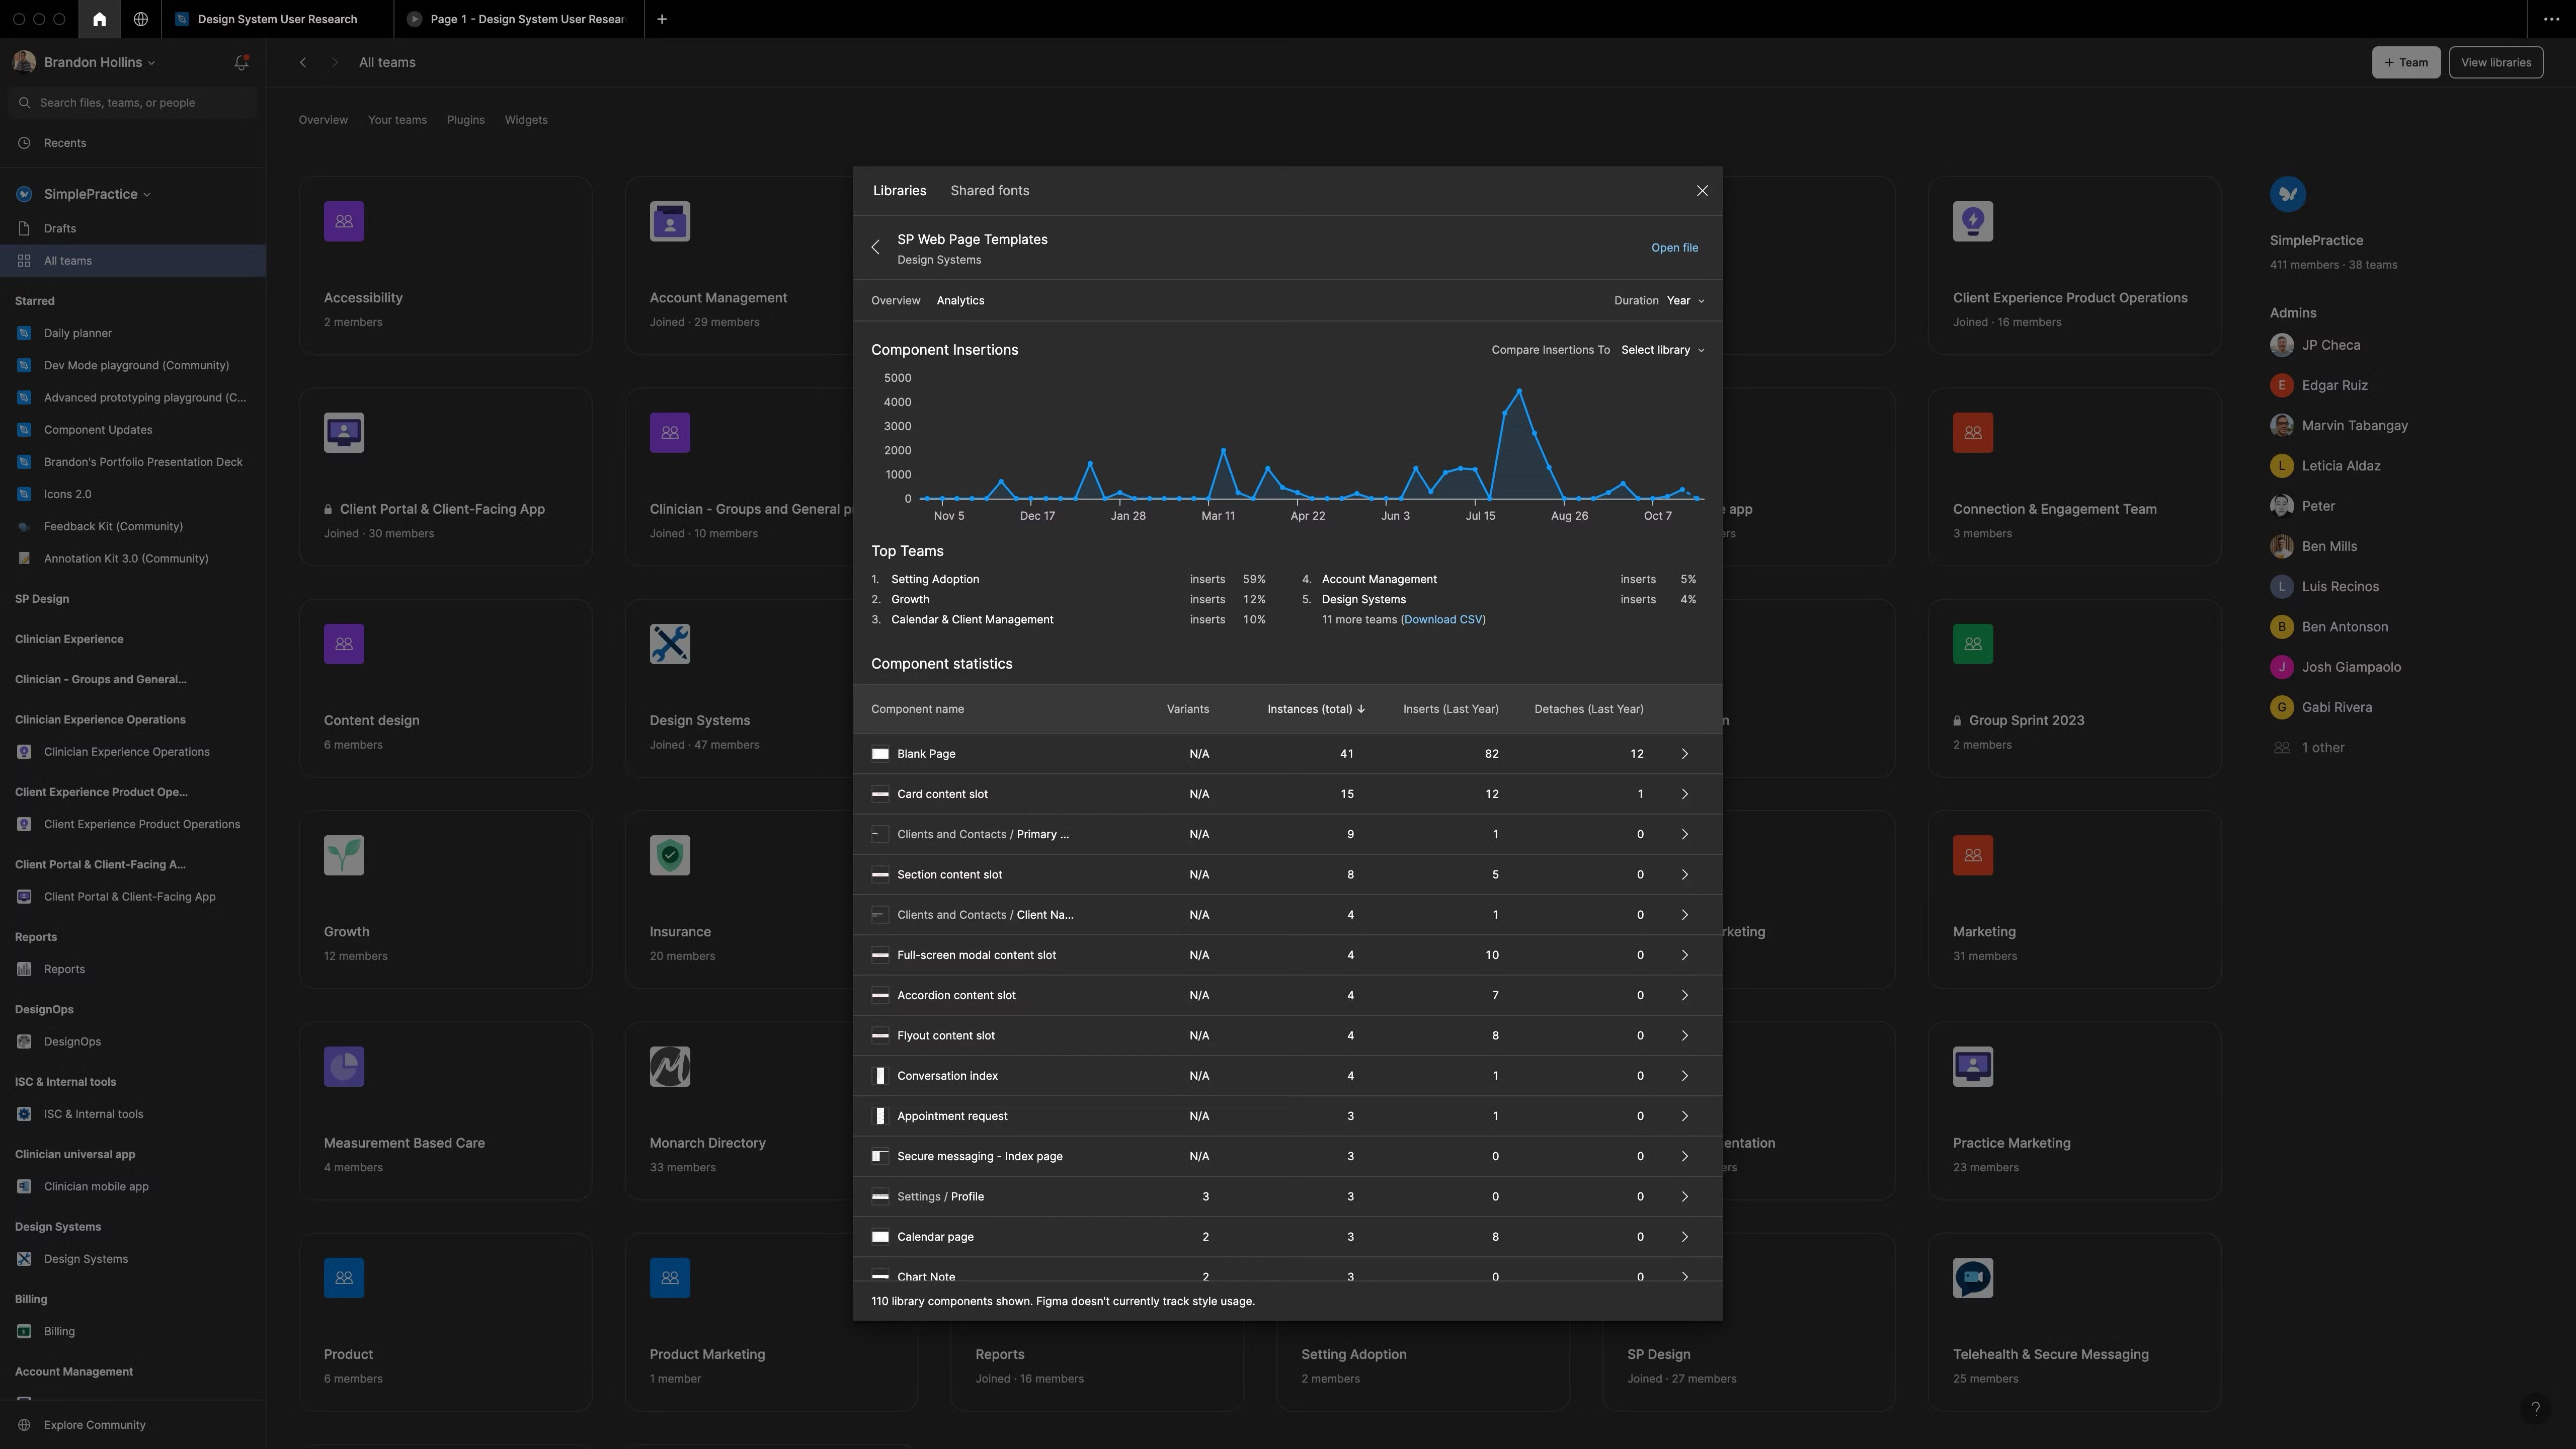
The insights gathered from Figma analytics during the design system project were indeed revelatory and pivotal to understanding real user engagement. The ability to track which components and libraries were actively being utilized provided a clear, data-driven picture of the design system's usage patterns. Notably, some of these findings were quite unexpected.
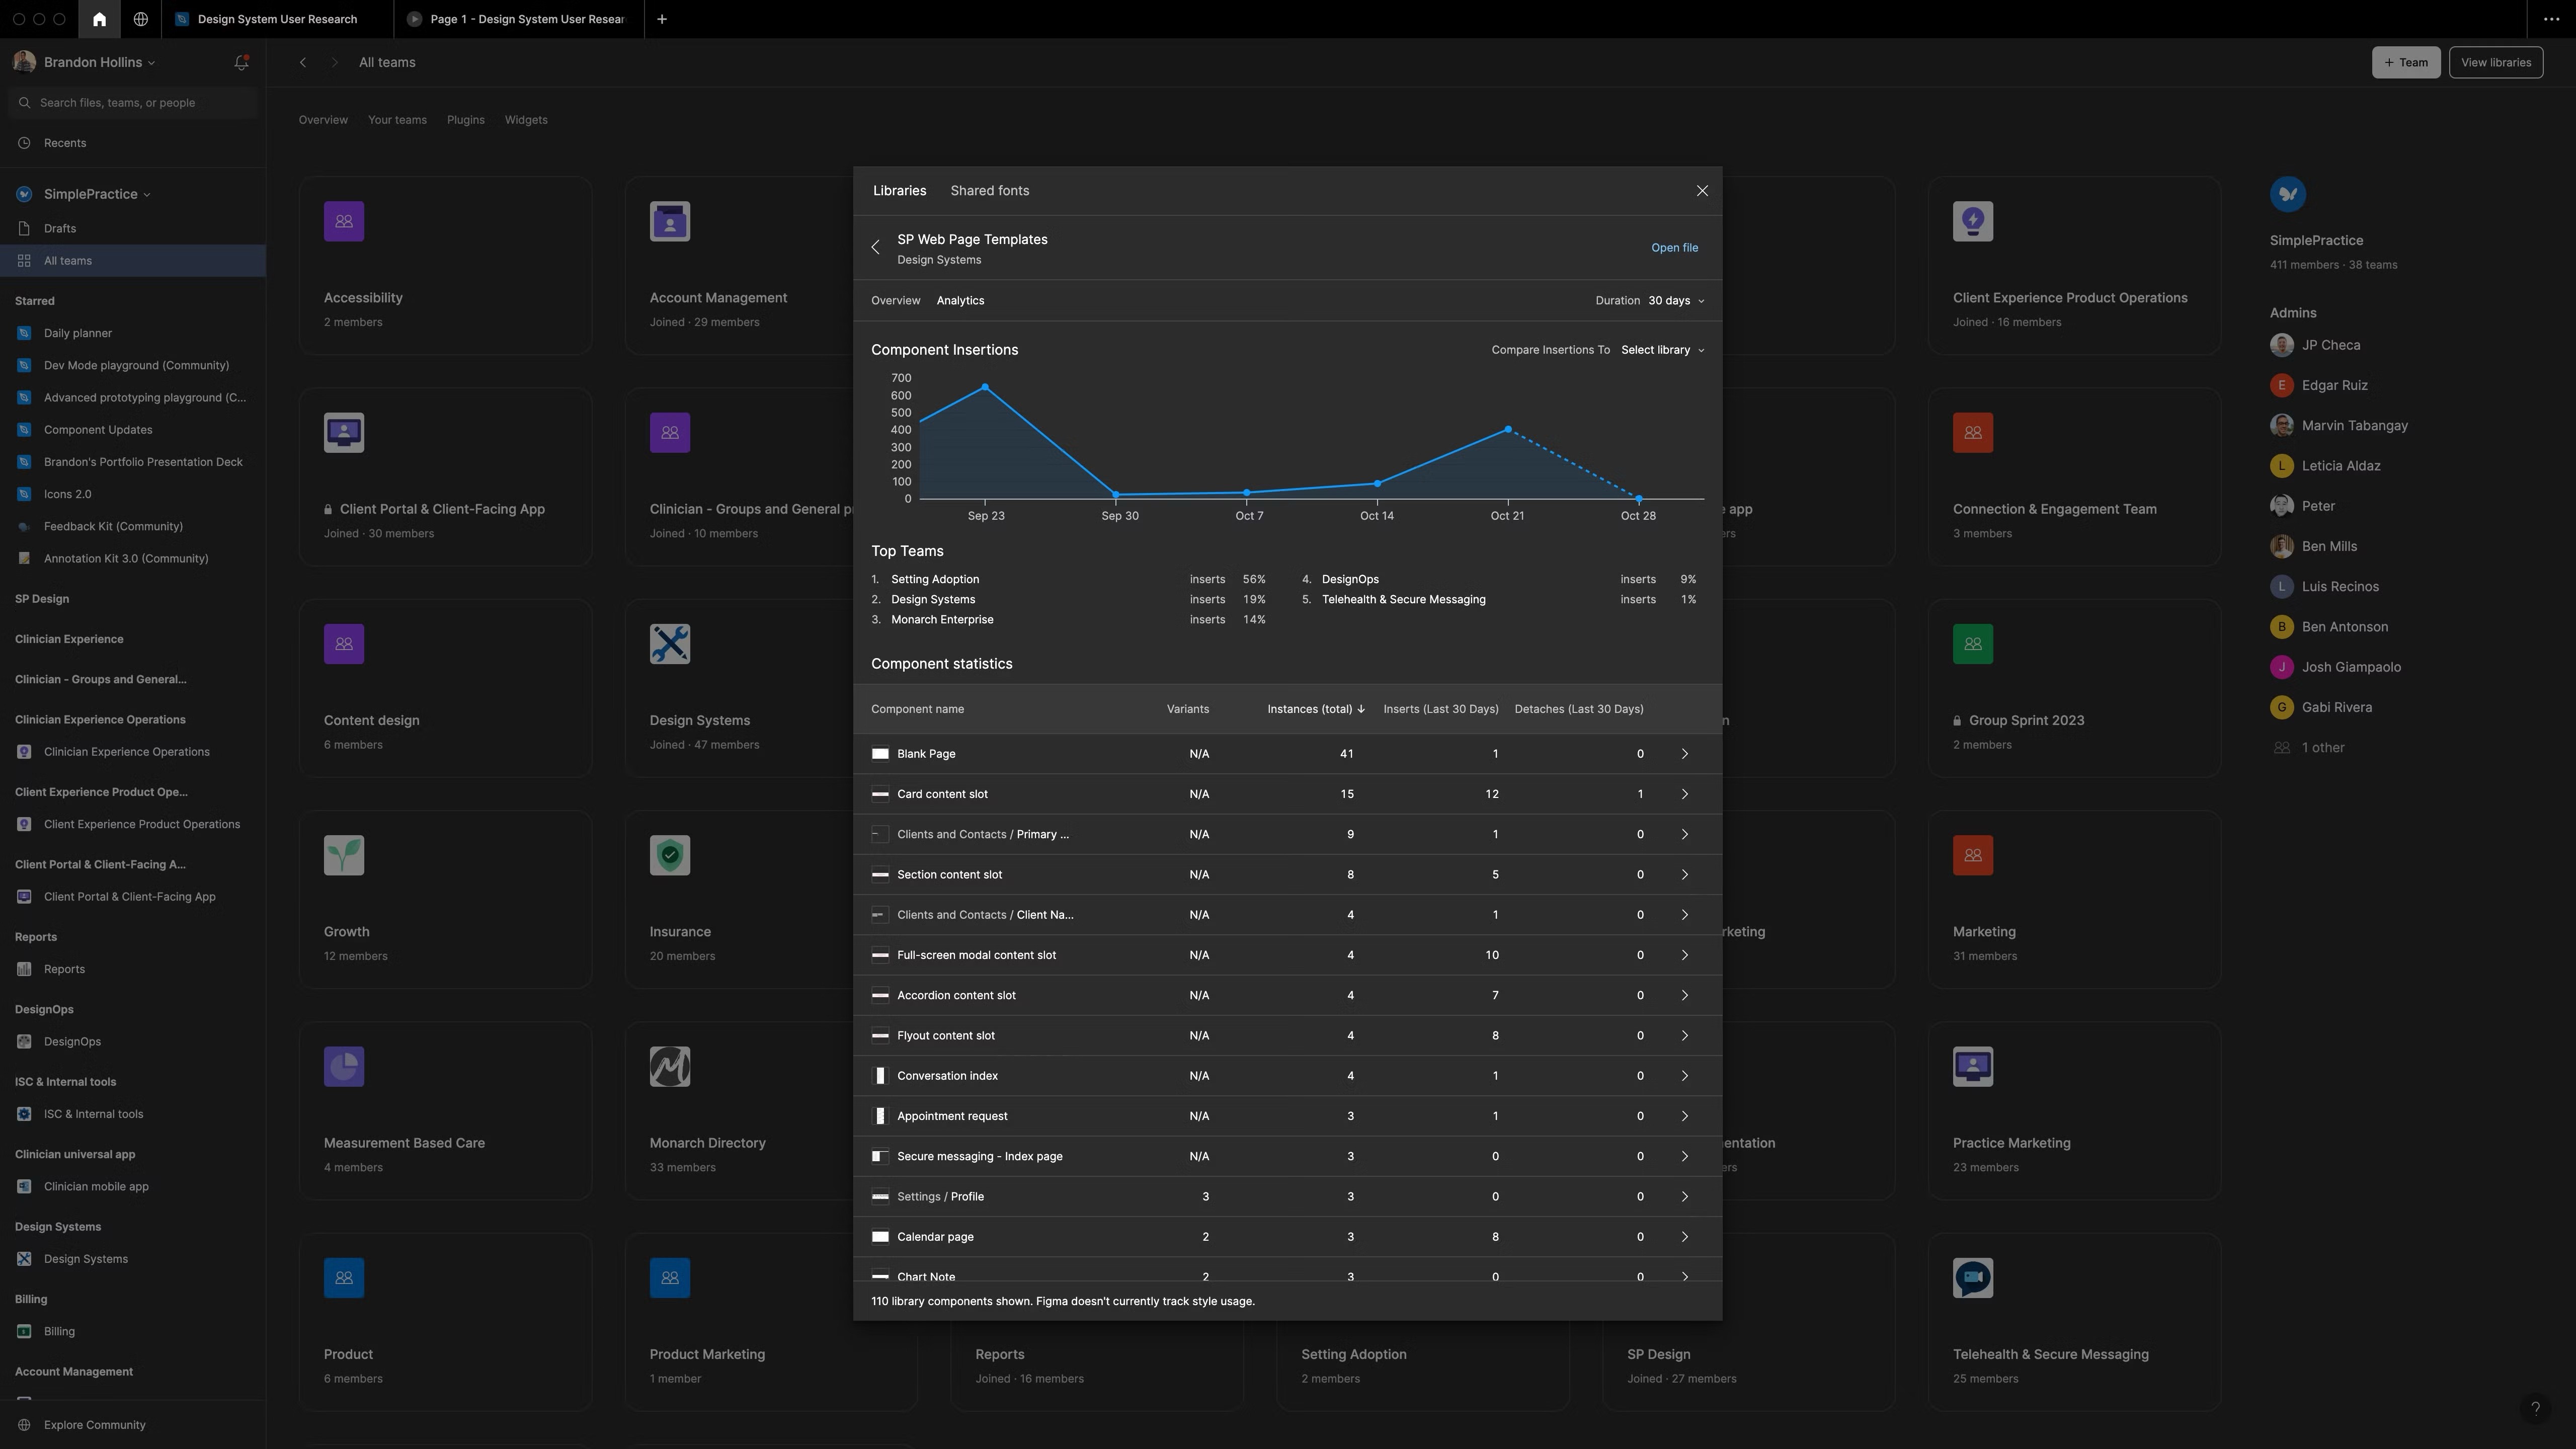
One of the more surprising revelations was the utilization of the template library created by the design system team. Initially, we assumed that this library would be a significant asset to all designers within the organization, streamlining their workflow and enhancing efficiency. However, the data told a different story. It emerged that the primary users of this library were, in fact, the members of the design system team ourselves. This unexpected outcome highlighted a critical lesson: the importance of grounding design decisions in actual data.
This was a game-changer. I learned a great lesson, especially in the realm of developing and maintaining design systems: the imperative of data-informed decision-making. It highlighted the importance of continuous feedback and data analysis. I truly understand that these practices are vital to ensure that the design tools and components we develop truly resonate with and meet the needs of their intended users. This experience has fundamentally shaped my approach to design system development, emphasizing the power and necessity of data in guiding design decisions.
OKRS + KPIS | POST-DATA ANALYSIS UPDATE
After analyzing the survey data and Figma analytics, I developed these new Key Performance Indicators (KPIs) and Objectives and Key Results (OKRs). These metrics aim to address the insights and findings gathered from the research, focusing on enhancing the usability, relevance, and frequency of use of our design system, boosting confidence and knowledge among users, streamlining interactions between designers and engineers, optimizing time allocation for design work, and enhancing accessibility and content design.
OBJECTIVE 1: ENHANCE COMPONENT USABILITY AND RELEVANCE
This objective targets the improvement of our component library to ensure it aligns more closely with user needs. The key results include identifying and addressing gaps in the current component library, informed by thorough user research, and actively reducing the reliance on outdated, archived components. We will measure our success through the number of newly identified components that fill existing gaps and a quantifiable decrease in the usage of archived components.
OBJECTIVE 2: INCREASE THE FREQUENCY AND USEFULNESS OF THE DESIGN SYSTEM
The second objective focuses on making the design system more integral and beneficial to our design tasks. We aim to see an uplift in the "Very Useful" ratings in our post-research surveys, indicating enhanced user satisfaction. Additionally, we're looking to increase the frequency at which the design system is consulted during design tasks. These improvements will be tracked through the percentage of positive ratings in follow-up surveys and the frequency of references to the design system in design-related activities.
OBJECTIVE 3: BOOST CONFIDENCE AND KNOWLEDGE AMONG USERS
For our third objective, we're focusing on elevating the confidence and expertise of our users when interacting with the design system. We plan to achieve this by increasing the average confidence level rating among users. This will be measured by the average confidence ratings gathered post-research and by tracking the development and utilization of new training modules designed to enhance user knowledge and skills.
OBJECTIVE 4: STREAMLINE INTERACTIONS BETWEEN DESIGNERS AND ENGINEERS
Improving the collaboration and communication between designers and engineers is crucial. The aim here is to reduce the frequency of clarification requests from engineers, indicative of a more intuitive and transparent system. Additionally, we're looking to implement new methods to facilitate smoother feedback and working processes between designers and engineers. Success in this area will be measured by the percentage reduction in clarification requests and the effectiveness of newly implemented collaboration methods.
OBJECTIVE 5: OPTIMIZE TIME ALLOCATION FOR DESIGN WORK
Optimizing how time is allocated in the design process is another vital goal. We're looking to reduce the time spent on selecting components and patterns, thereby freeing up more time for brainstorming and creative tasks - aspects crucial to innovative design. The progress here will be monitored through the percentage reduction in time spent on component selection and the increase in time dedicated to brainstorming and creative endeavors.
OBJECTIVE 6: ENHANCE ACCESSIBILITY AND CONTENT DESIGN
We're committed to enhancing the accessibility and content design aspects of our design system. This involves introducing comprehensive accessibility guidelines and incorporating effective content design strategies into the system. The effectiveness of these enhancements will be measured by the number of accessibility guidelines and content design strategies successfully integrated into the system.
Using these KPIs and OKRs, we can track our progress in achieving these objectives and ensure that our design system evolves in alignment with the needs and expectations of our teams. These metrics will guide us in identifying and filling gaps in the component library, reducing the usage of archived components, increasing the usefulness of the design system, improving confidence levels among users, reducing clarification requests from engineers, optimizing time allocation for design work, and enhancing accessibility and content design.
UNDERSTANDING OUR TEAMS UTILIZATION OF FIGMA
After documenting the new KPIs and OKRs based on our design system data, my next step was to conduct user research to better understand how our teams utilize Figma and our design system. This research initiative aimed to assess the familiarity and usage habits of different groups, including designers, engineers, and stakeholders, in relation to Figma.
To achieve this, I planned a series of research phases: the Pre-Assessment Interview/Survey, the Task-Based Figma Exercise, and the Post-Assessment Interview/Survey.
In the Pre-Assessment phase, I designed tailored questions to assess each group's proficiency, common usage scenarios, feature utilization, collaboration habits, challenges faced, and suggestions for improvement. This phase aimed to gather insights into how our teams interact with Figma and identify any pain points or areas of improvement.
The Task-Based Figma Exercise involved presenting participants with a series of design or development tasks that simulated real-world scenarios. For designers, tasks included creating reusable components or using variants, while engineers were tasked with extracting design tokens or exporting assets. Stakeholders, such as product managers or executives, were asked to navigate complex Figma files or provide design feedback. This phase aimed to provide a hands-on evaluation of how our teams use Figma in their daily work.
In the Post-Assessment phase, I conducted interviews to gather qualitative feedback from participants. This allowed them to share their experiences, challenges, and suggestions for improving Figma to better fit their workflows. The goal of this phase was to gain a deeper understanding of the underlying reasons behind our teams' actions and their specific association with Figma.

